Prefabricated vertical drains
Drain spacing you can put your name on
PVDCal solves the consolidation equation for your actual profile — layer by layer, with smear, vacuum, staged loading and creep — and answers the three questions a drain project asks: how far apart, how long to wait, and how sure can you be.
It is a unit-cell solver: one drain, the soil cylinder it serves, and a no-flow outer boundary — resolved in radius and depth rather than read off a chart.
A card is needed to start the trial. Cancel any time before it ends.
- 8
- closed-form benchmarks, run from inside the app
- < 0.6 pp
- mean absolute error on every one of them
- P10–P90
- spacing bands, not a single false-precision number
- 249 pages
- of user guide, free to download
One soil model, three questions
Design, simulate, and learn from the field
The same solver runs in three directions, so a design and the back-analysis that checks it share one set of physics.
Design
Give a target degree of consolidation and a date. The tool searches the radius of influence and returns the spacing that meets it, for square and triangular patterns.
See it in the app →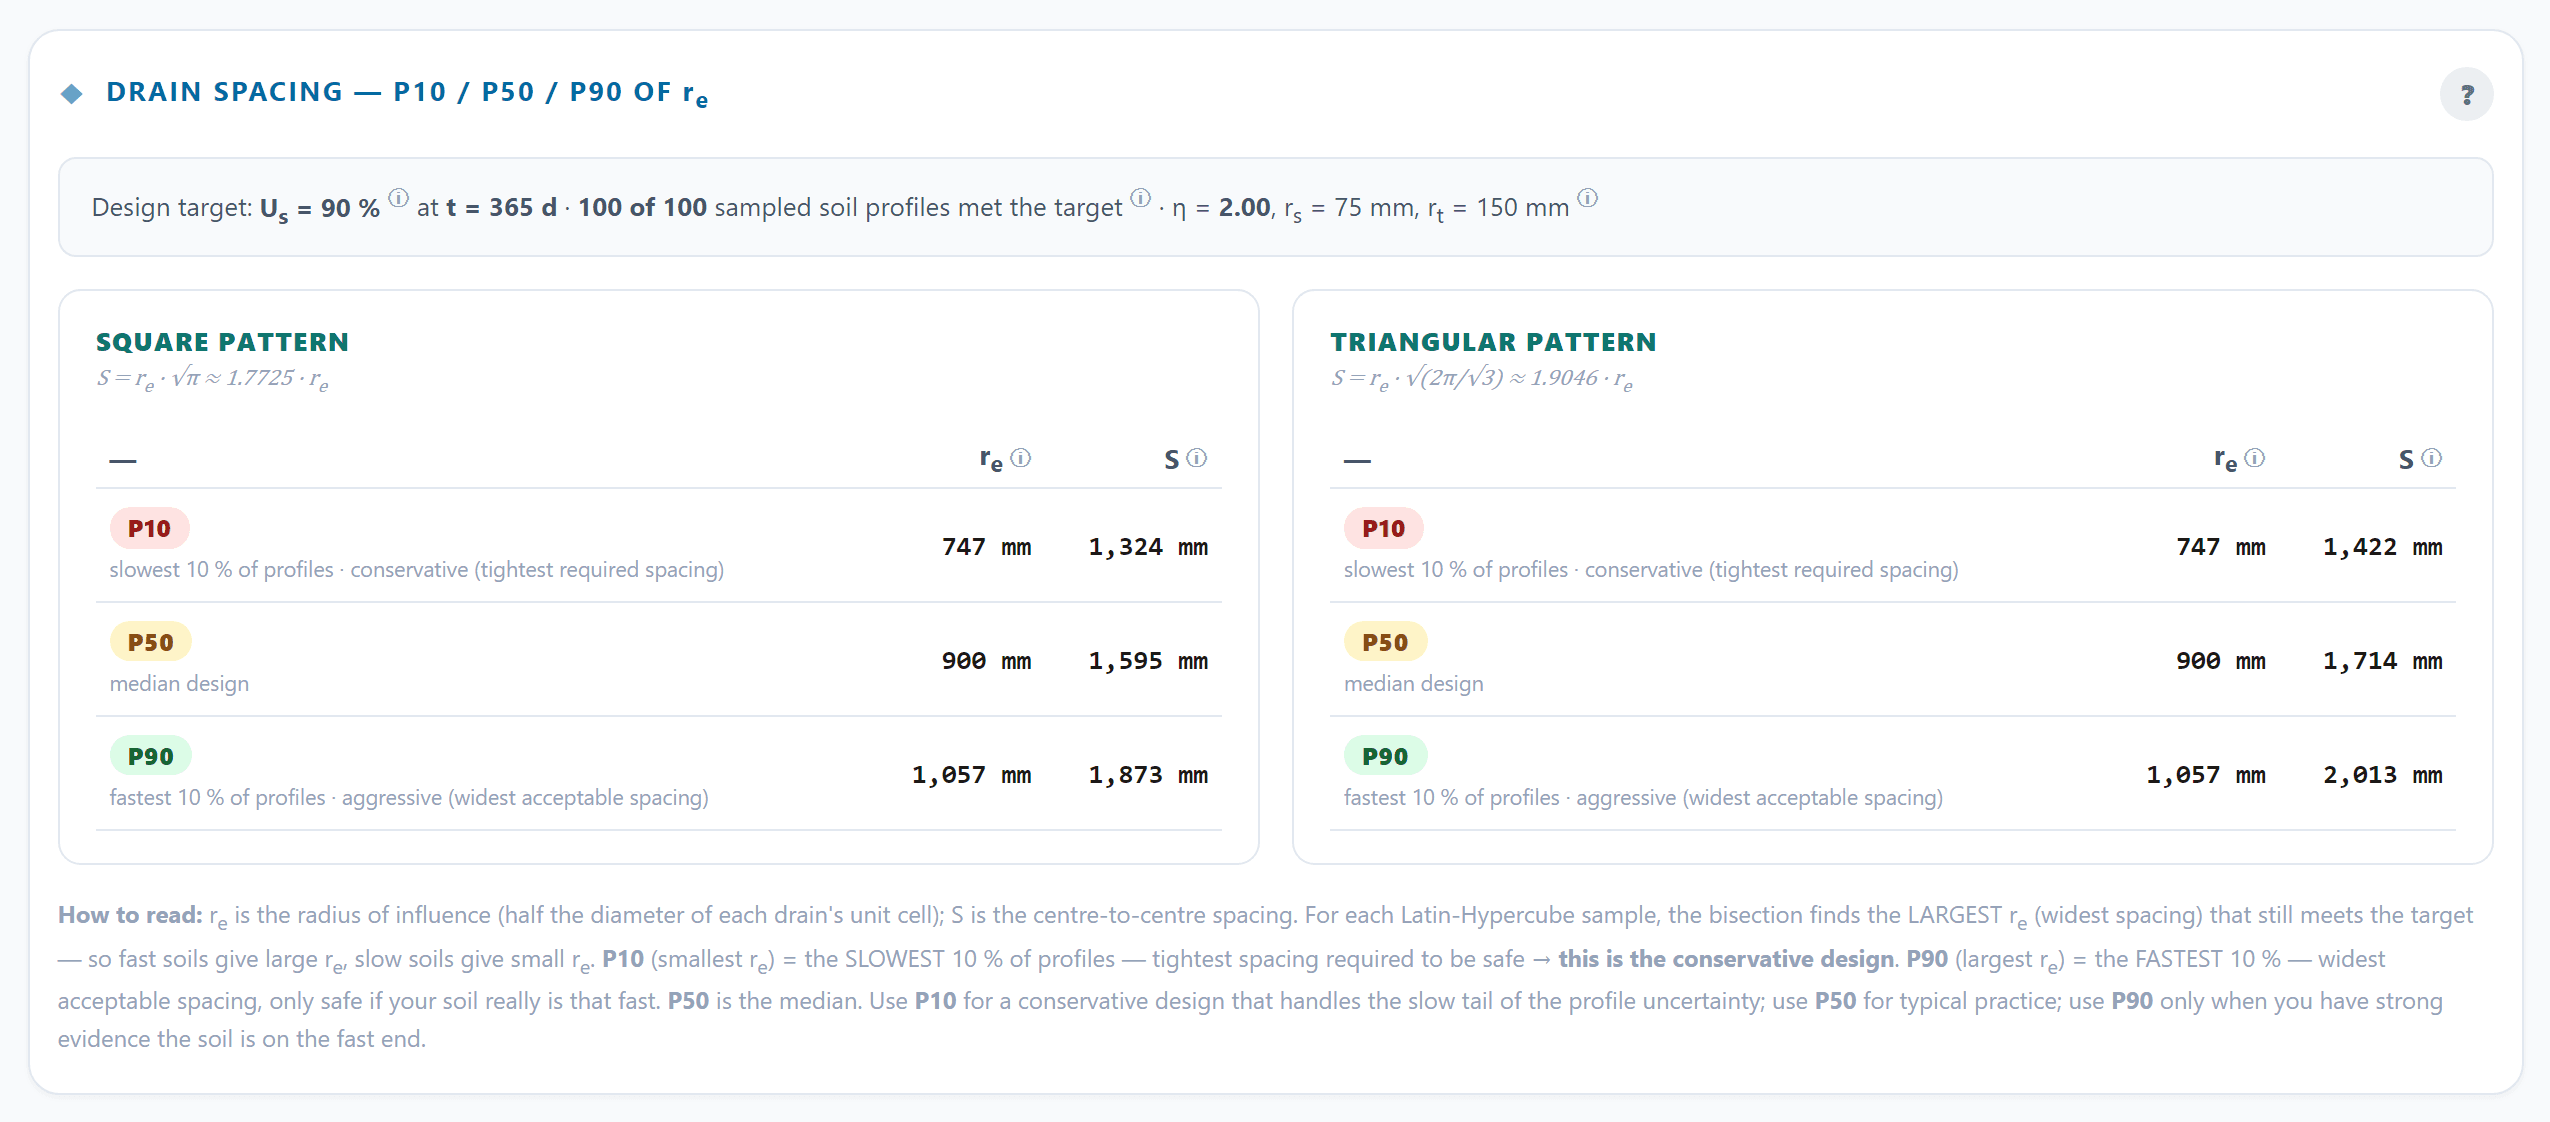
Simulate
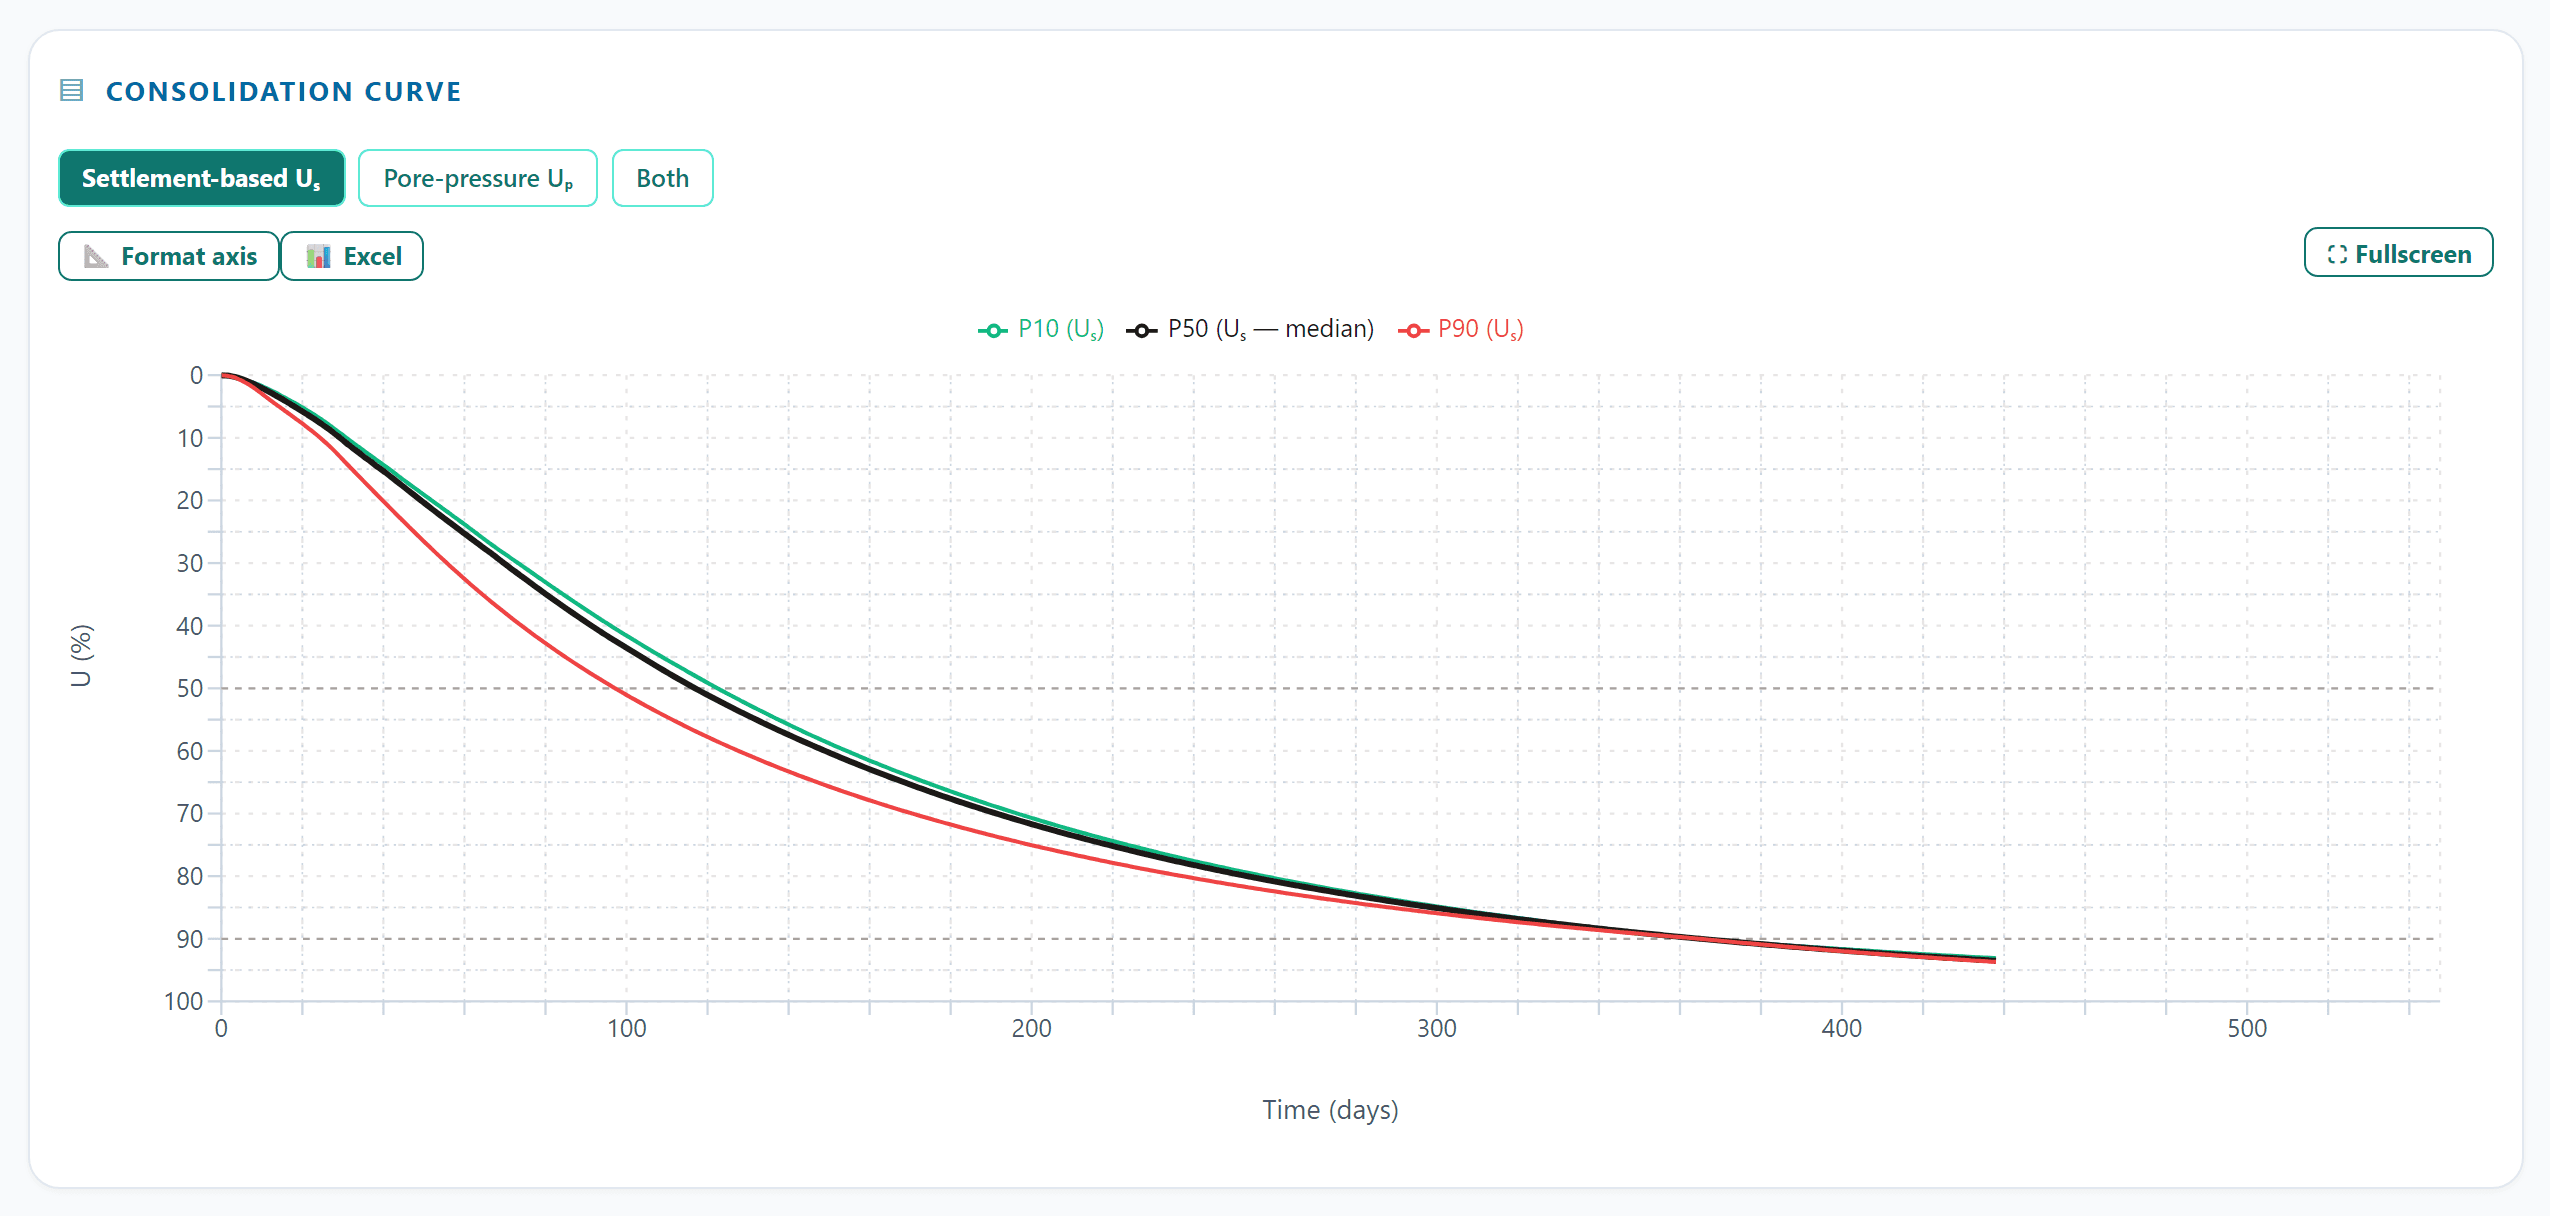
Give a spacing. The tool returns settlement and degree of consolidation against time, with the effective-stress profile and the compression path behind them.
See it in the app →Back-analysis & forecast
Give settlement plate and piezometer records. The tool calibrates the ground parameters that explain them, then forecasts the rest with a credible range.
See it in the app →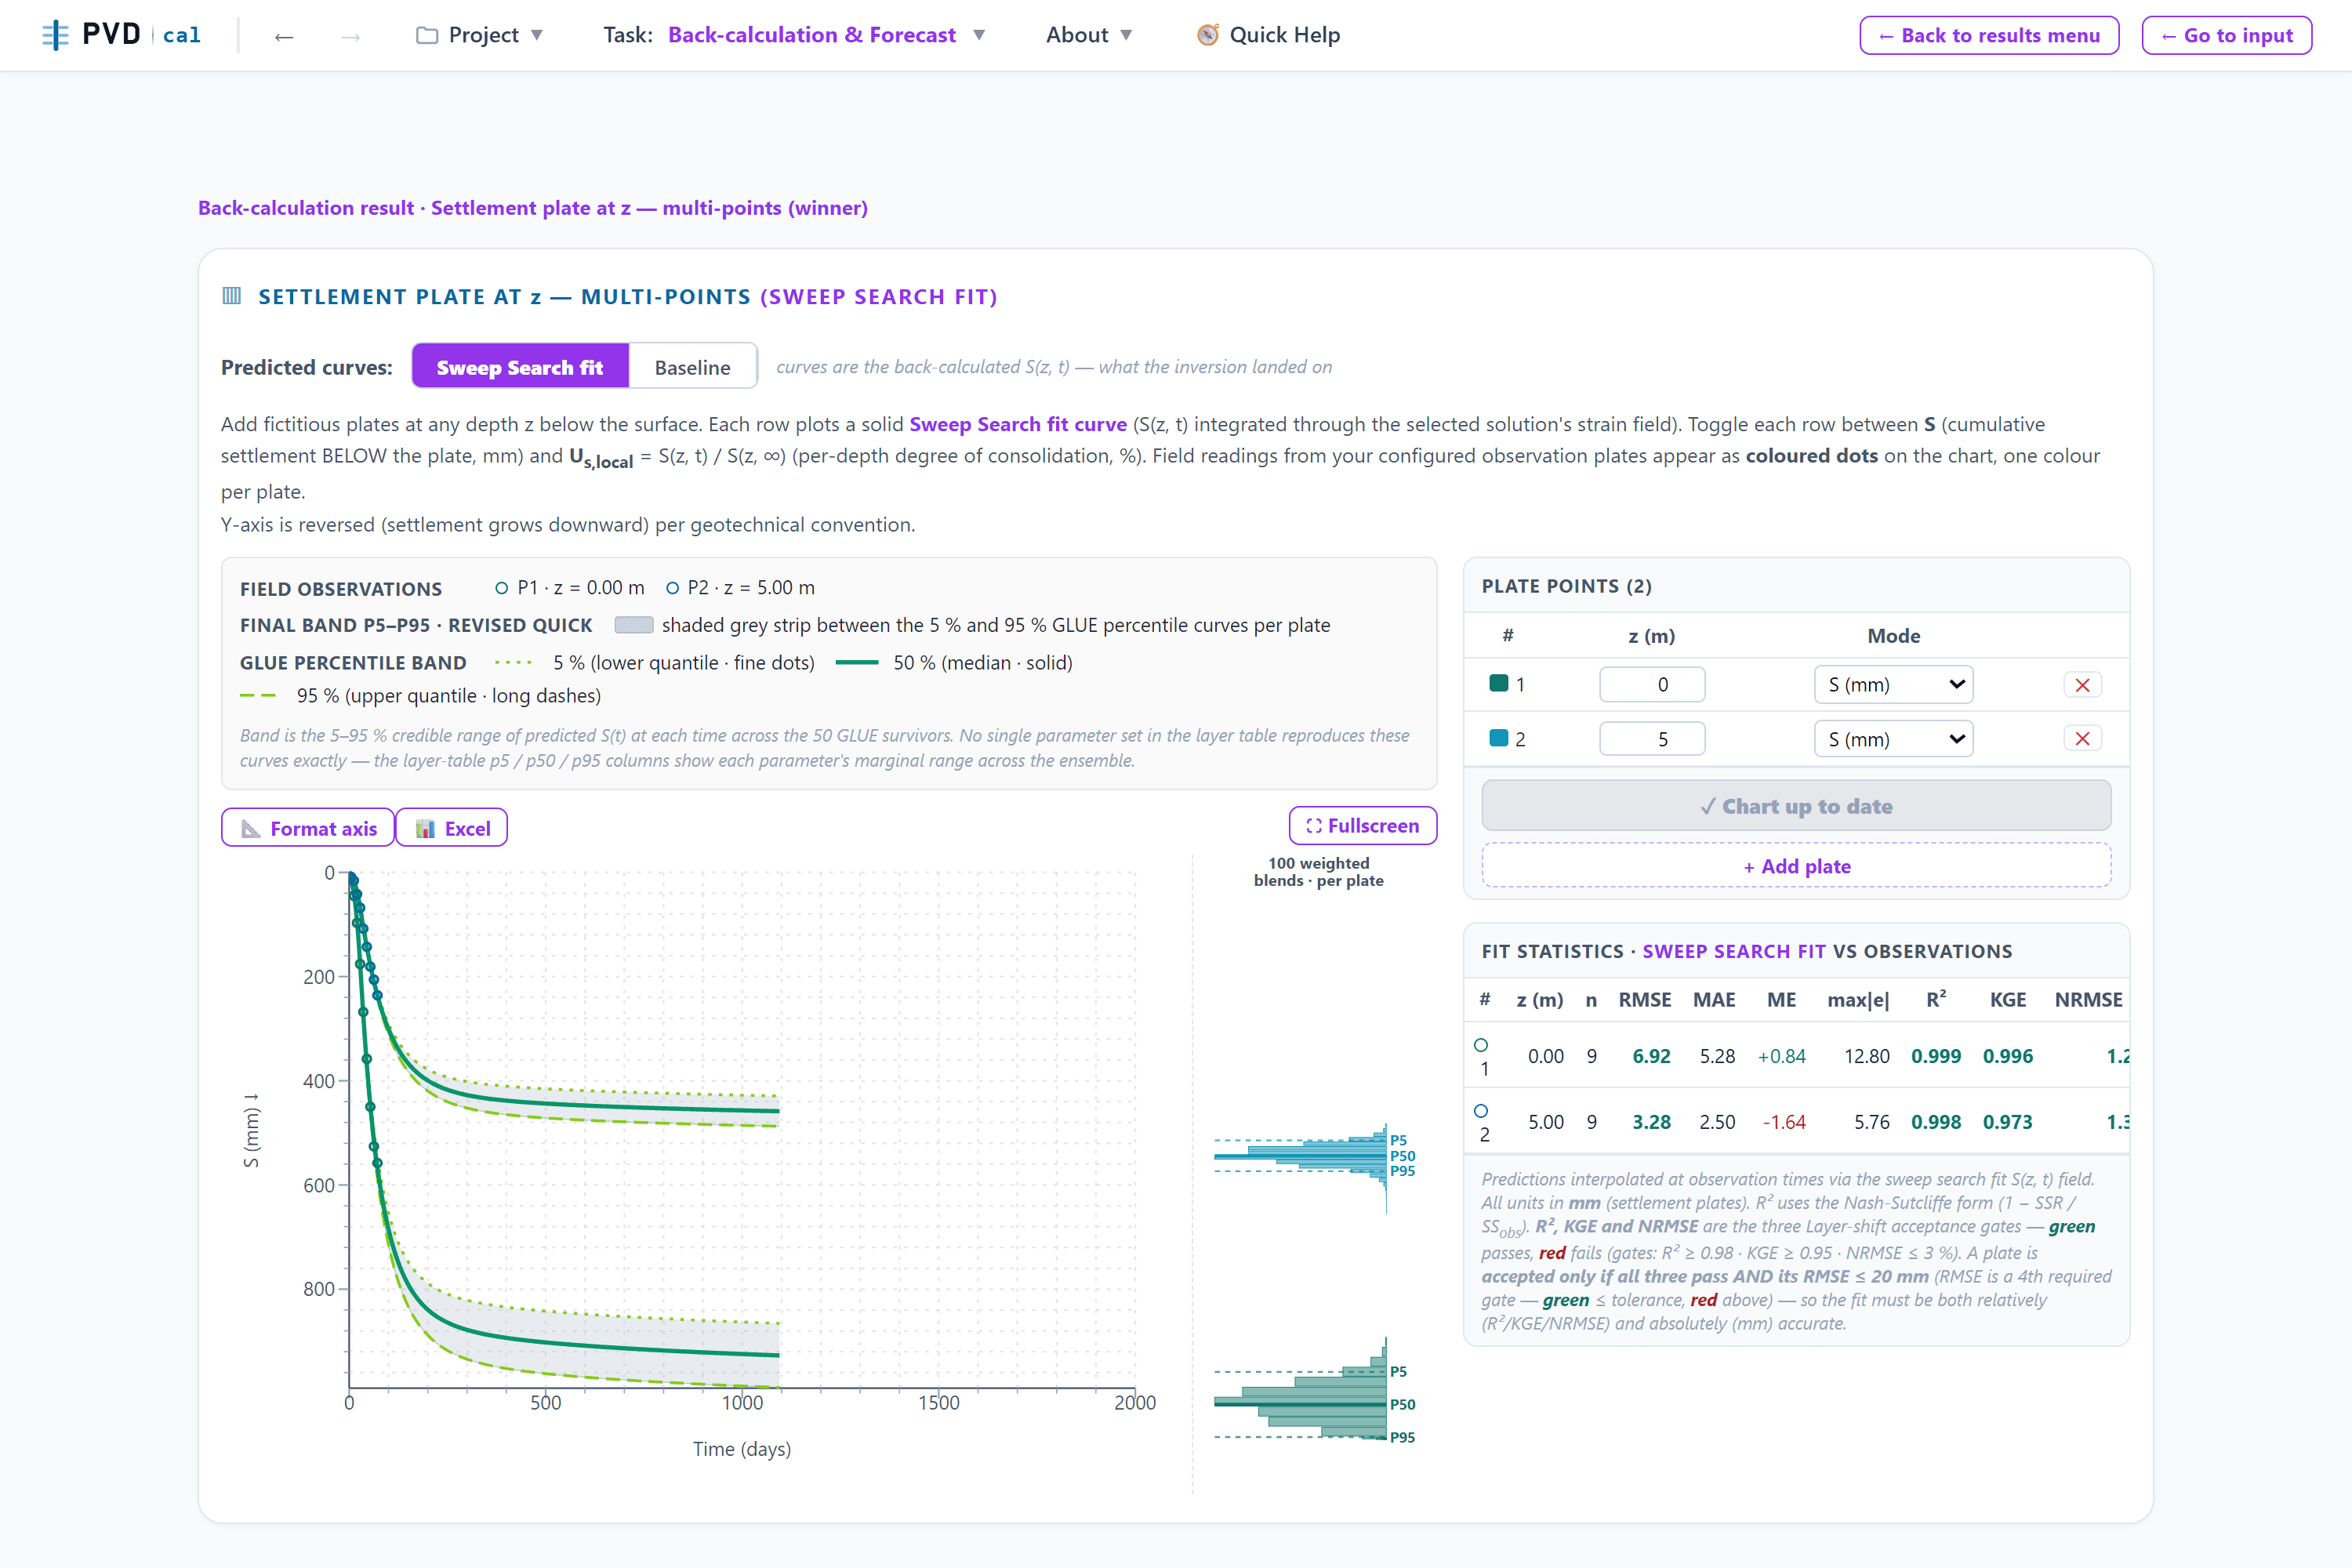
Real ground, not a chart
The complications that design charts leave out
Charts assume one uniform layer, instantaneous loading and a constant coefficient of consolidation. Ground obliges none of that, so PVDCal carries the complications explicitly.
Layered profiles
Every layer keeps its own compression indices, preconsolidation pressure, void ratio and permeability. Flux continuity is enforced at each interface.
Smear and transition zones
The disturbed annulus and the transition to intact soil are meshed explicitly, with mesh faces landing exactly on the zone boundaries.
Vacuum preloading
Suction enters as a wall value on the drain, with depth loss, and adds to the embankment schedule rather than replacing it.
Partially penetrating drains
Drains that stop short of the base are modelled as they are: the untreated layer keeps draining vertically, with a full-disk core below the tip.
Staged loading
Ramps, rest periods and multi-stage construction, with unload and reload following a recompression path rather than the virgin line.
Creep and stress dependence
Secondary compression through the Cα/Cc ratio, and a consolidation coefficient that follows effective stress instead of staying constant.
A smooth transition through yielding
The compression index is blended across the yielding zone rather than stepped at the preconsolidation pressure, because a natural deposit does not yield all at once.
A heat map of the whole cell
Play consolidation through the programme as an animated map of radius against depth, slice it at any depth or radius, and export it as an animation for your report.
Uncertainty, handled
A band you can design to
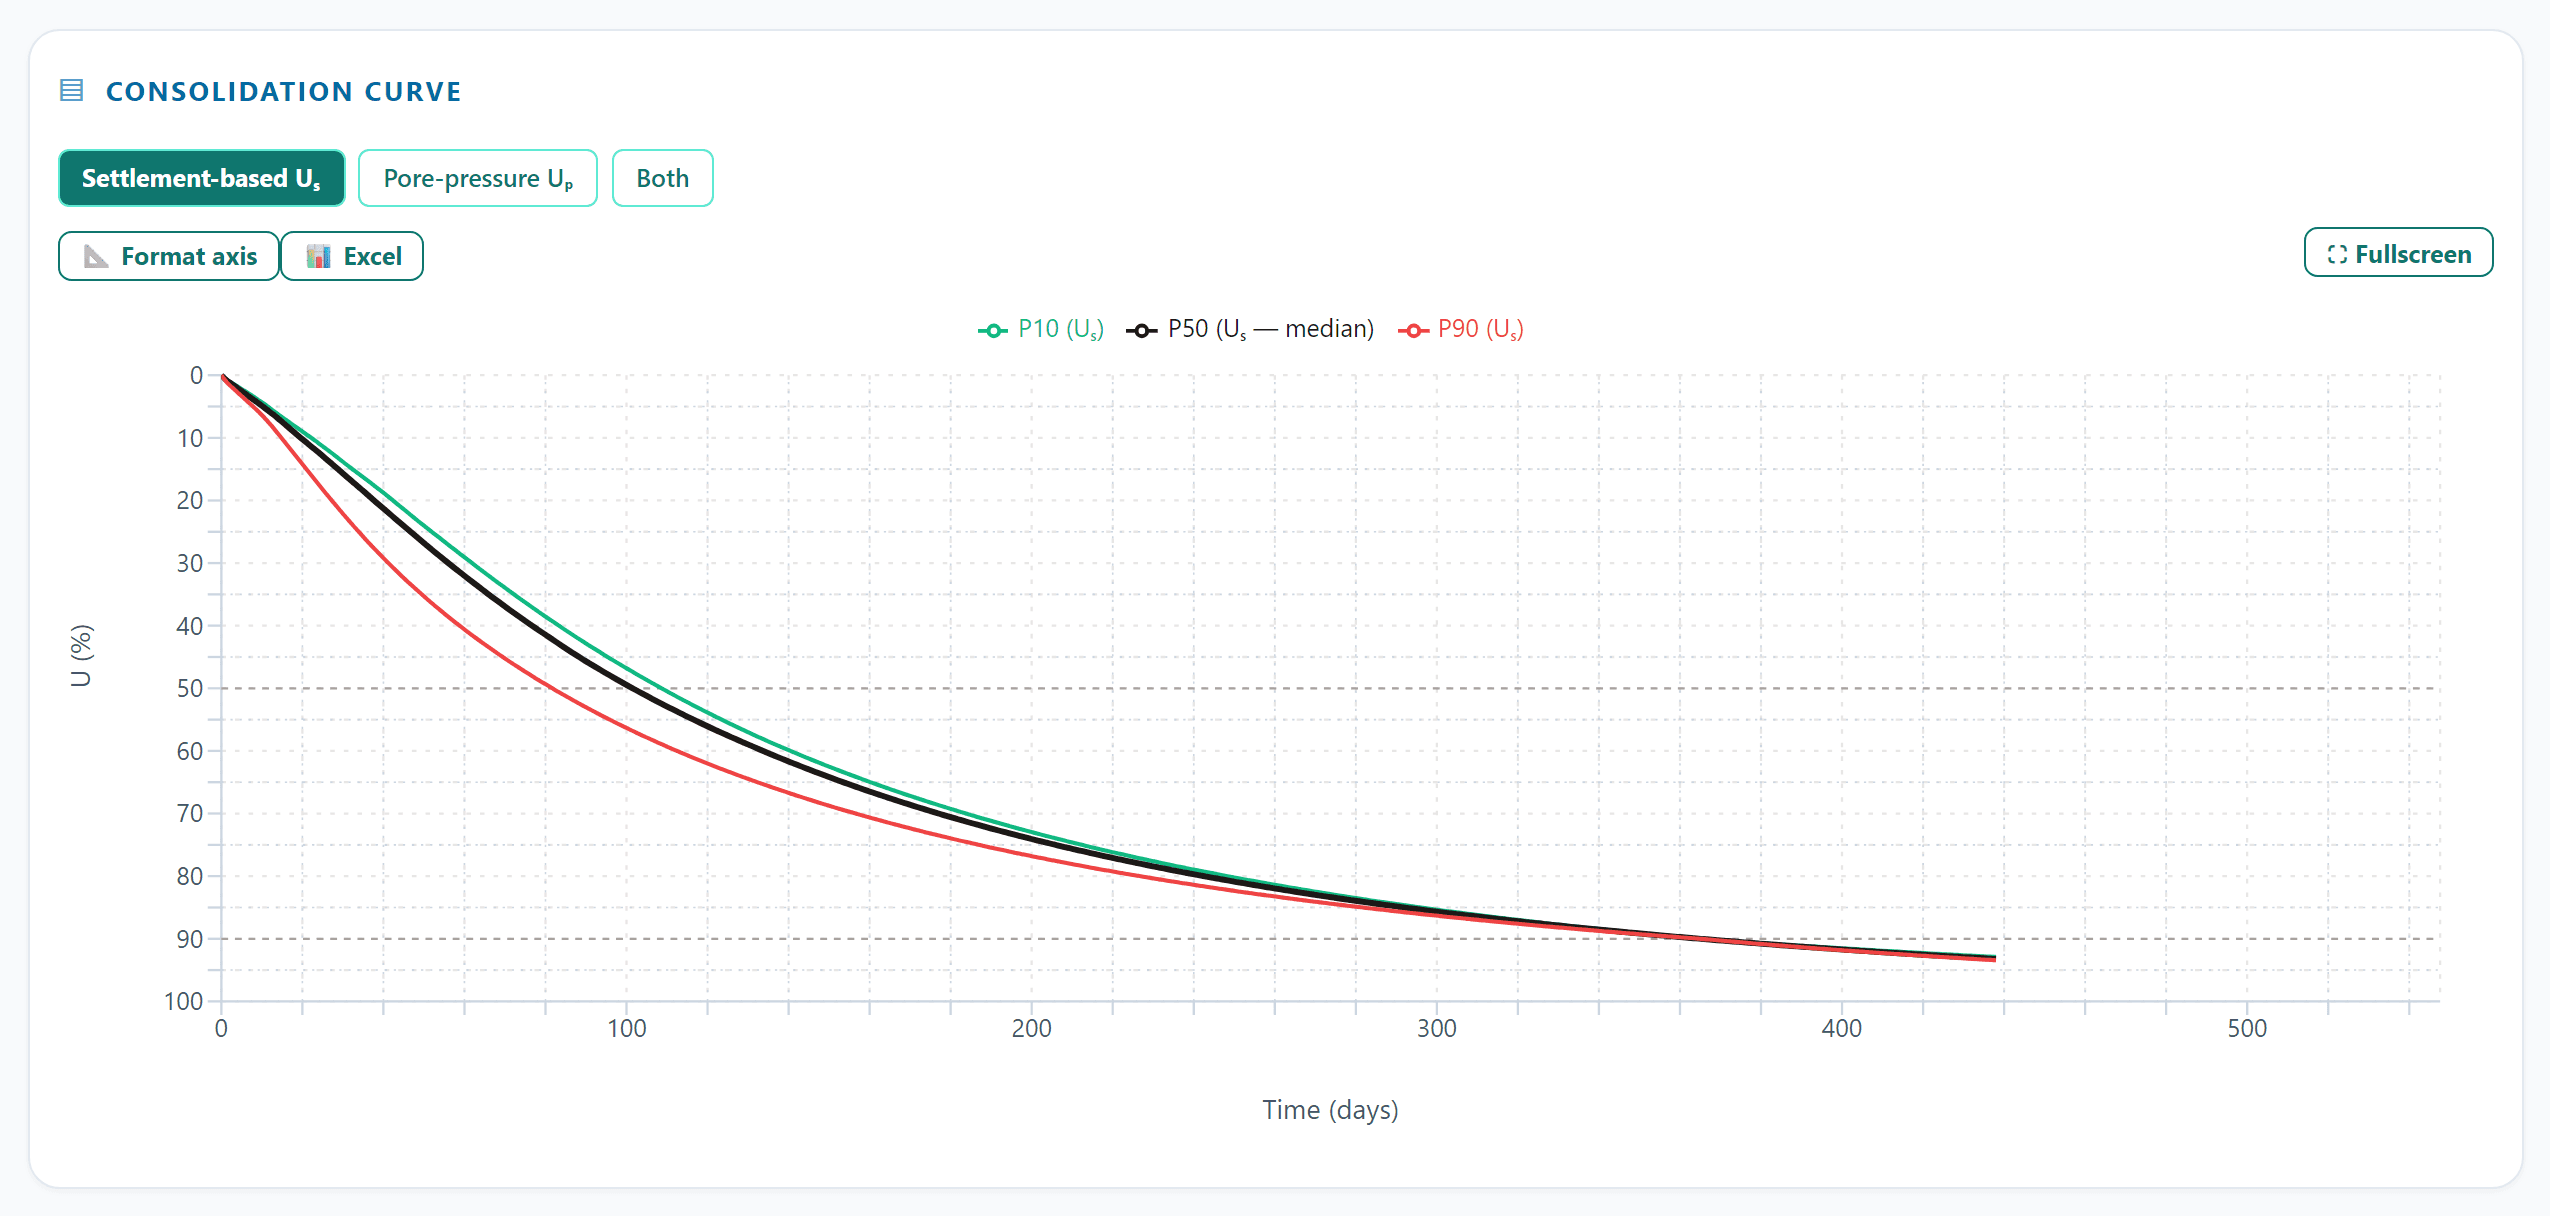
Soil parameters come as ranges, so an answer should too. Enter a range for any input and PVDCal runs a Latin-Hypercube sample — a full spacing search per sample, on a pool of parallel workers — and reports the P10, P50 and P90 spacing.
A sensitivity card then ranks which input actually moved the answer, so you know where another borehole or laboratory test is worth its cost.
Back-analysis and forecast
Let the embankment tell you what the ground is
Feed in settlement plates and piezometers. PVDCal searches the parameter space for the soil that explains the record, reports how well it fits, and forecasts the remaining settlement with a credible range.
Against a monitored embankment in the user guide, the forecast from a 400-day record landed within 1.5 % of the final measured settlement, and within 0.8 % from a 700-day record.
Read the worked example →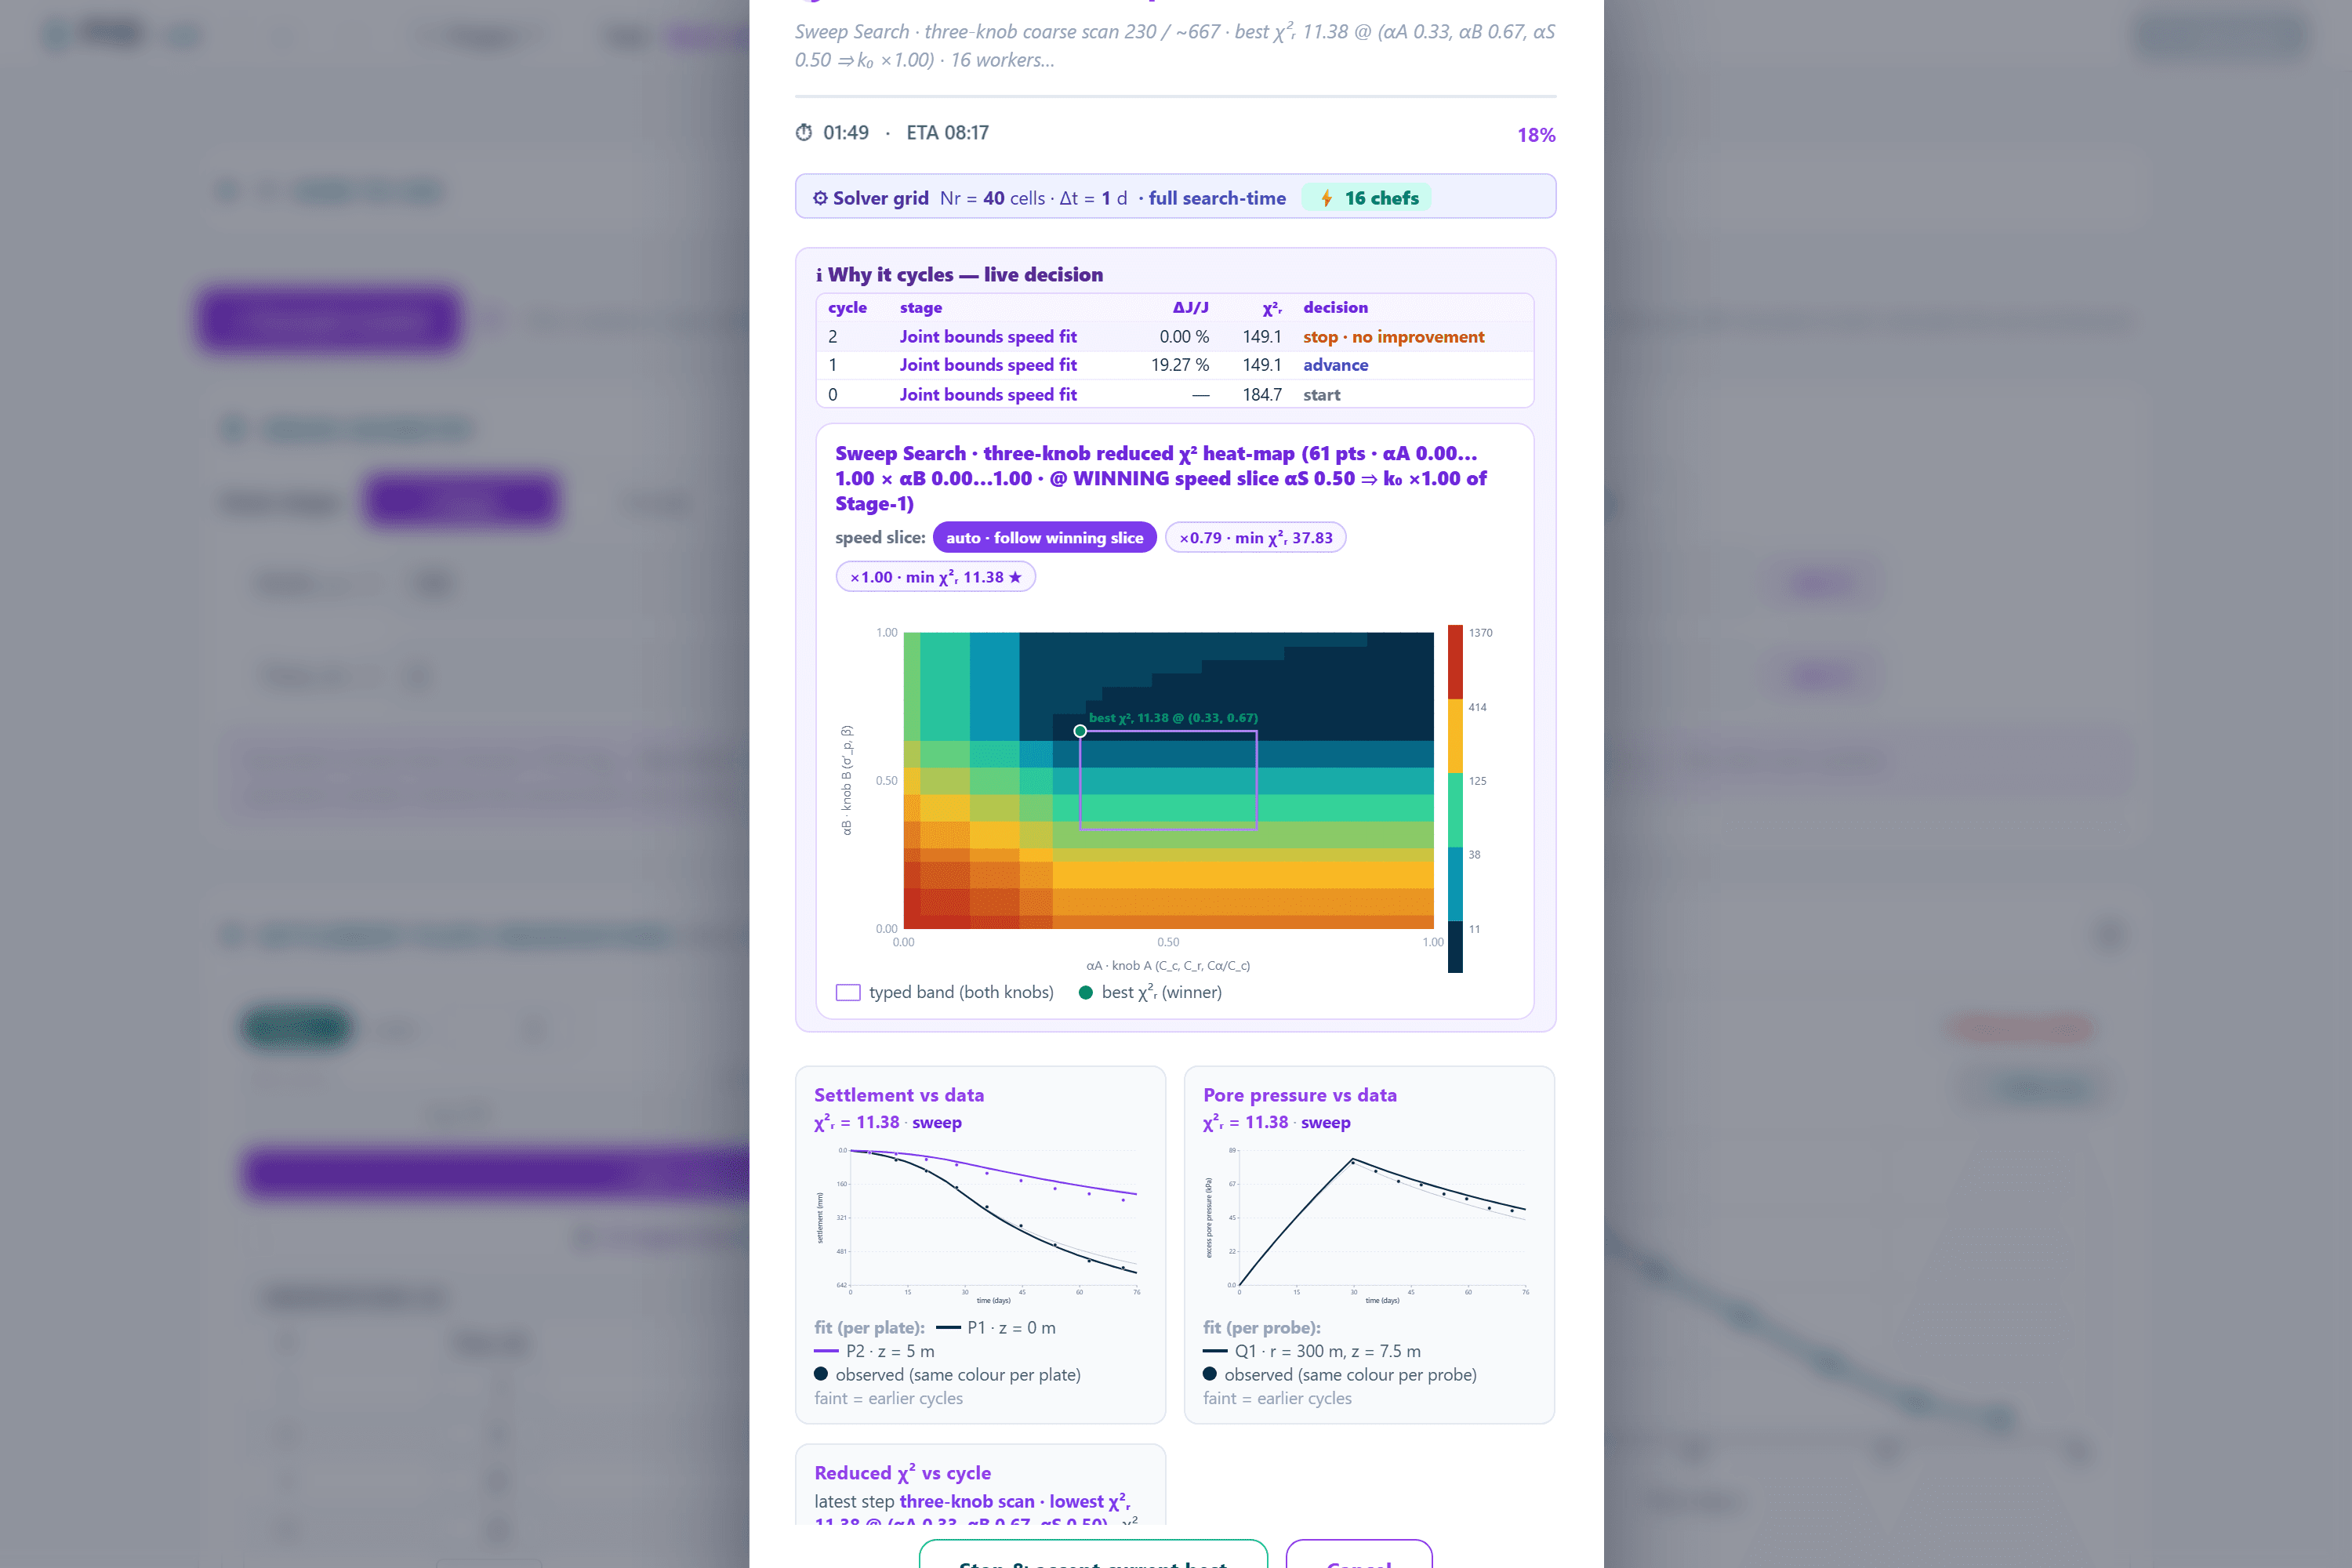
Where it fits
Beside your existing software, not instead of it
Three-dimensional packages, finite-element suites and settlement tools each do their own job well. PVDCal takes the part they treat most coarsely — the drain system itself — and hands the answer back to them.
Calibrate here, model anywhere
Back-analysis returns the layer parameters your other software takes as input, recovered from the monitoring record rather than assumed.
Check a design from anywhere
Restate a design made elsewhere, and see what the finer physics and the uncertainty band change about it.
Read the record beside any model
Readings import from CSV or Excel, results export the same way, and the project travels as a single file.
Outside the treated area — differential settlement, stability, structures — those packages remain the right tools. How the division of labour works →
Try it on your own profile
Start a 7-day free trial. Load an example project, change the soil to yours, and see the spacing band in minutes.